United States Airports
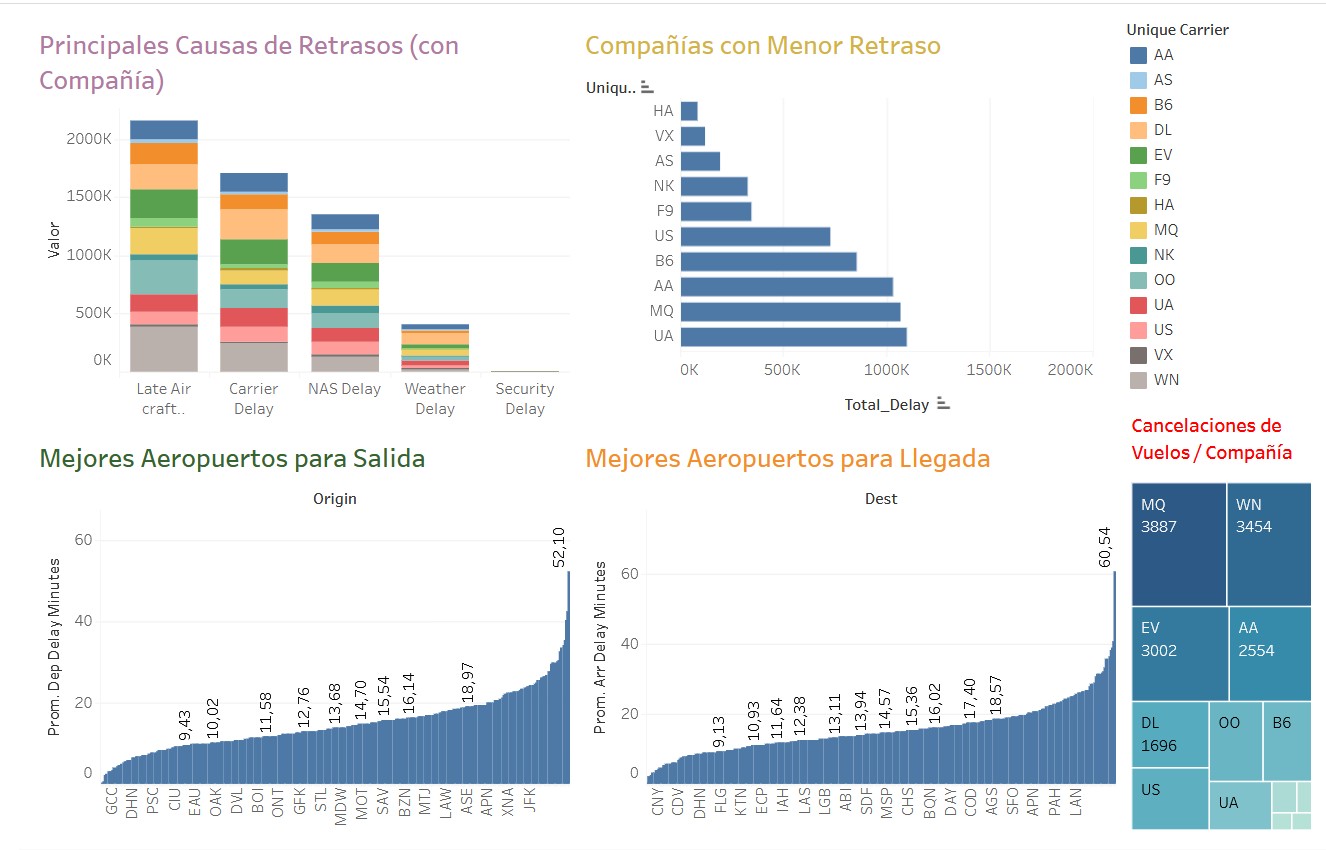
This visualization analyzes US airports in terms of flight delays and cancellations, which are more common of what people want; and also takes into account the main causes for these situations.
It also includes a classification of airports according to the average times they present in terms of delays, ordering them from lowest to highest, thus indicating the best airports for take-off and the best ones for landing.
Not always the fault is of the airport, often it is of the company or airline, so a rating showing the airlines with the lowest average delay.
Project information
- Category: Data Visualization
- Tools: Tableau
- Project Date: December, 2022
- Project URL: Tableau Public Site