Football Clubs (2012 to 2023)
This visualization offers interesting and not obvious results about football, having as input a set of data that includes Players, clubs, leagues, countries, seasons and performance statistics from 2012 to 2023. The analysis reveals patterns and trends in club performance over time, providing a deeper understanding of sport and its competitive dynamics.
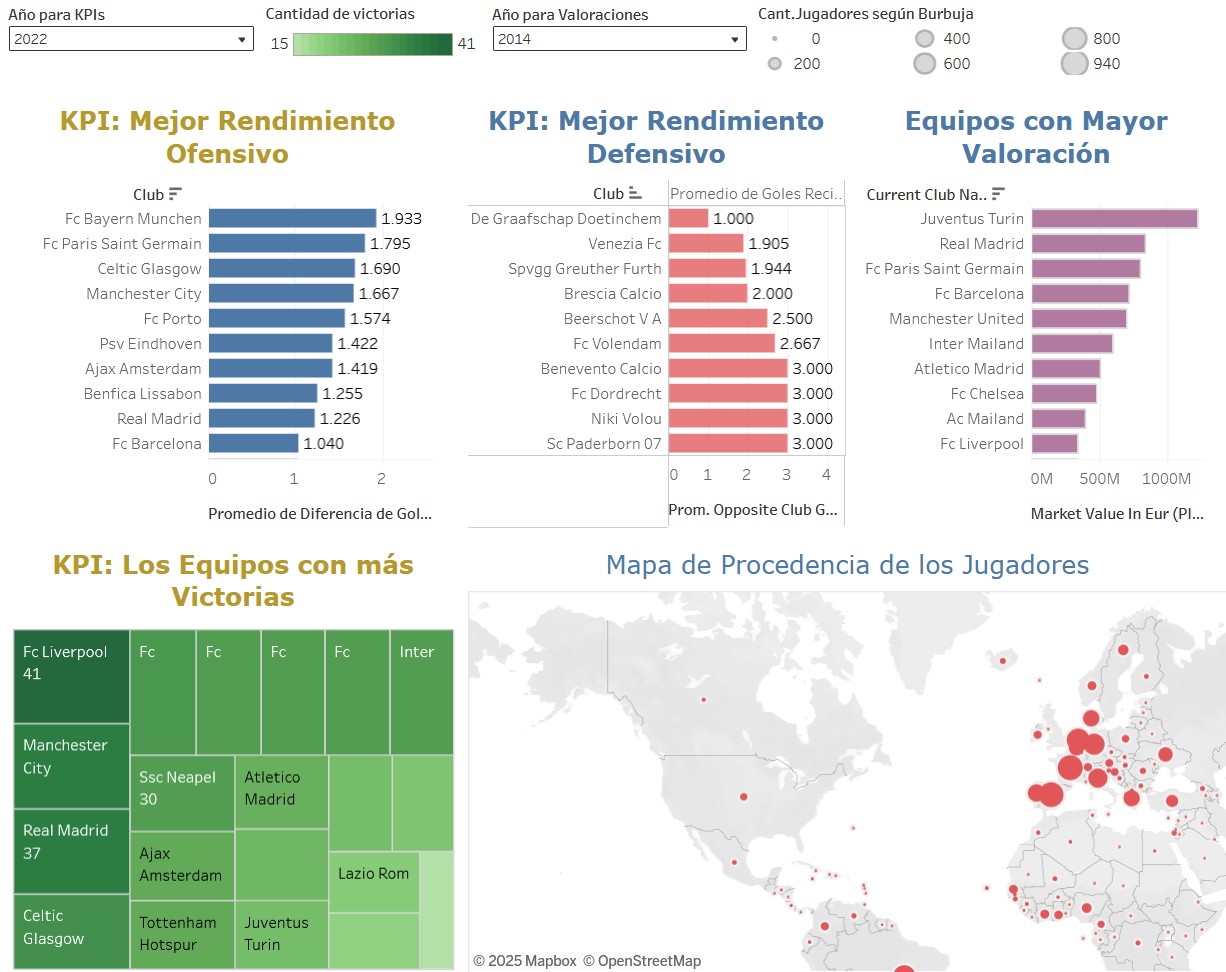
A link to the project is provided in Tableau Public to explore the data and interactive visualizations in a dashboard, where you can compare the results of some KPIs such as Best Offensive Performance, which is calculated as the average goal difference in all matches of a club for the chosen year, as the "goals for" is a measure that could be counterbalanced with "goals against" and turn out to be negative.
Best Defensive Performance is another interesting KPI, which is calculated as the average of goals against in all matches of a club, because the defensive system of a team has as its only purpose to prevent the opposing team from scoring goals.
Finally it offers some curious data for the chosen year, such as the teams with more victories and their valuations in Euros, so as a map showing the countries that contribute the most players to the leagues analysed.
Project information
- Category: Data Visualization
- Tools: Tableau
- Project Date: May, 2025
- Project URL: Tableau Public Site